
ProChart HTML5 - Charting and technical analysis for your web application
Professional level charting that's free to roam .. Desktop, Tablet, Phone
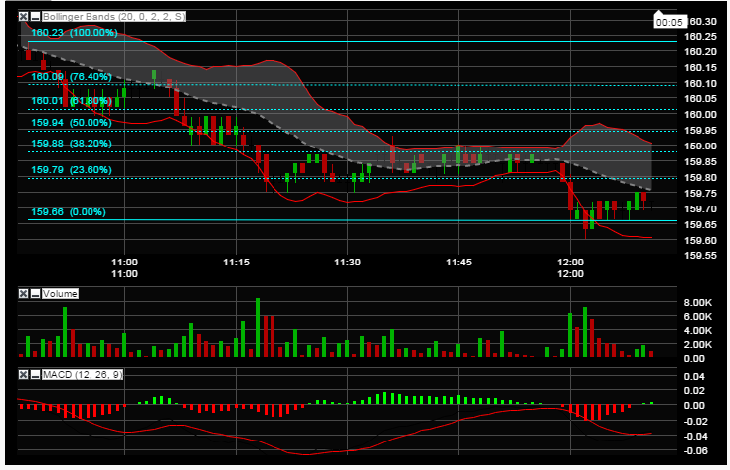
Visual Engineering is proud to bring you the JavaScript/HTML5 version of its' flagship financial charting software, Visual:ProChart. This product incorporates all the features of our widely used Java-based Visual:ProChart product in a JavaScript version designed for use in HTML5 environments. This version of ProChart can be used in applications that run anywhere: desktops, tablets, or phones.
Like the Java based desktop version of ProChart, the JavaScript version displays real-time data, and performs live analytics. Users can create simple or complex alerts using ProChart’s rule engine. Real-time alerts are triggered with live data changes, and historical condition changes are displayed with the chart to provide insight into pricing behavior.
Flexibility, Functionality and Performance .. Game on!
The JavaScript version of ProChart is designed with the flexibility and features you need to incorporate it into your own product. Data source functions are easily pluggable and user-defined. Localization is designed in. The code doesn’t pollute your global namespace with a bunch of extraneous stuff, so you won’t have to worry about name conflicts. ProChart includes support for custom templates and persistence through a built-in and well-tested persistence mechanism. The built-in portion of ProChart’s UI also provides several different UI approaches so you can make our dialogs your dialogs, whether you’re using JQuery, Dart, AngularJS, or practically any other popular framework.
It's all about user experience .. You've got zip without the right UX!
One of the primary advantages of using HTML5 is its’ availability on a wide range of platforms. The JavaScript edition of Visual:ProChart uses 3 distinctly different sets of UX heuristics so you provide the right user experience on any platform. For example, on tablets and phones, ProChart uses tools like pinch zoom, automatic magnifiers, and oversize draw tool drag handles so users can get real work done on a small display. On desktops, dialogs are more complex, and mouse cursors give more fine-tuned feedback, to use the capabilities available in a larger display. Whatever platforms your application targets, Visual:ProChart gives you a polished financial charting tool that will put you ahead of the pack.
Key Integration Features:
- User-defined data sources
- User-defined localization
- Flexible (CSS) definitions for dialogs and other UI elements
- Built-in template and persistence support
- Built-in support for multiple UX styles: Desktop, Tablet, Phone
- Small footprint, minimal access of JavaScript’s global namespace
ProChart HTML5 - Selected Features
Chart Types:
- Time based: Line, Bar, Candle, Heiken-Ashi, Scatter, Step, Mountain
- Price Action based: Point & Figure, Renko, Kagi, Three Line Break
The same feature set as ProChart Java/.NET - to see a more detailed list go to ProChart Java/.NET