KavaChart Gallery .. Scatter Plots
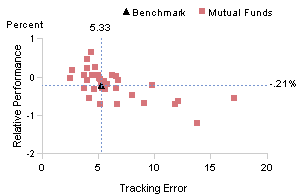
Annualized Relative Average Performance |
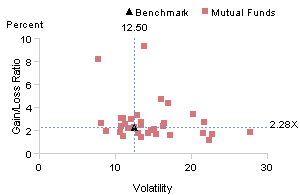
Annualized Gain/Loss Ratio |
||
 |

|
||
Actively managed funds may increase volatility (risk) and risk should be compensated for by greater returns relative to a benchmark. Tracking error is the degree to which fund volatility differs from its benchmark. Performance is measured relative to the benchmark. |
Gain/Loss ratio is simply the sum of positive gains each month divided by the sum of the losses. Volatility is a measure of risk. One might expect high and low gain loss ratios to be associated with relatively high volatility. |
||
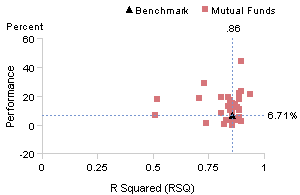
Annualized Average Performance |
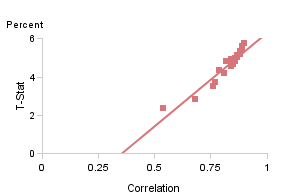
Annualized Correlation |
||

|

|
||
R-squared (RSQ) is a statistical measure used to estimate the degree to which a fund's performance is explained by the performance of a benchmark. For example a fund with a RSQ of .86 relative to the S&P 500 means that 86% of the funds historical performance can be explained by the performance of the S&P 500. |
Correlation is a measure of how two variables behave relative to one another. Funds whose performance moves together over time are correlated. T-stat is a measure of the reliability of the correlation (or correlation coefficient). This chart indicates, with a farily high degree of reliability that the performance of these funds is positively correlated and as a group they will move in the same direction. |

