KavaChart Gallery .. Special
| New Foods Product Group - R&D Product: Barebrier - Alternate Formulations |
|
||||||||||||||||
 |
|
||||||||||||||||
|
|
|
||||||||||||||||
| Orion Software, Inc. Product Revenues by Region - 2005 |
Orion Software, Inc. Regional Revenues by Product - 2005 |
||||||||||||||||
|
|
|
||||||||||||||||
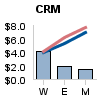
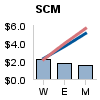
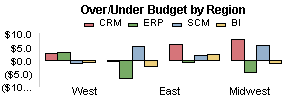
The "sector" chart above tells us our CRM product is generating the most revenues and BI the least. The West is leading other regions but the Midwest and East aren't far behind .. "mouseover" for details. |
Here we're slicing product revenues by region. Clearly the product mix within region is evenly distributed, no product orphans here. The revenue potential in the East is about the same as the West, so the East may be under-achieving and the MW over-achieving. |
||||||||||||||||
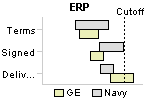
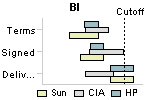
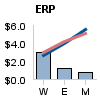
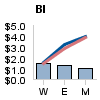
The following charts are complementary to the "sector" chart above. The chart directly below looks at revenue plan variances by region. ERP sales are sagging in the East and MWest and BI is a little behind in the same regions. Why? the next two charts show revenue recognition problems in the East and MWest. |
The "pareto" charts below are complementary to the "sector" chart above. Each pareto chart looks at revenue, by product, from high to low by region. The red line represents cumulative revenue and the blue line is plan revenue. A lot of information in a small space. |
||||||||||||||||
|
|
||||||||||||||||
|
|
||||||||||||||||
|
Ad Campaign for East & Midwest Regions, Products All |
||||||||||||||||
|
|
|
||||||||||||||||