
Helpful Links:
KavaChart in Action - Examples and Documentation - ProServe
[ Back ] KavaChart Scriptlet Examples
|
These pages demonstrate how to use KavaChart to generate dynamic
graphics from Java scriptlets. The JSPs below
show how easy it is to add charts to your web application.
Although KavaChart's ChartTags are probably a better solution for deploying your web applications, these pages show what's going on inside a KavaChart Tag. You could even decide to create your own custom Tag or servlet based on the KavaChart's server object architecture. |
Some of these pages use locally
contrived data (usually random numbers), and others "scrape" data from public web servers.
Every example has source code you can experiment with to see
what KavaChart can do for you.
At the bottom of this page you'll find documentation and other useful links. |
Basic Examples
|
Run jsp
See source
A very simple chart. This creates a ProSeve chart object, sets some data and style properties, and retrieves a generated image within an <IMG> tag. This is typical of how KavaChart ProServe operates in most scriptlets. |
|
|
Run jsp
See source
This page combines random numbers with a Pie Chart definition to generate a chart. Since it's a Pie Chart, we use antialiasing in our style to smooth the edges. |
|
|
Run jsp
See source
So far, we've set our data using chart object properties. While this works well for most situations, a better approach is to implement a "DataProvider" object, which can be used in a portable way with both scriptlets and chart tags, and can be used with all sorts of charts. |
|
|
Run jsp
See source
ProServe chart objects can also be used to create Adobe Flash© output. While it's generally easier to use the ProServe tag library to generate all the OBJECT and EMBED syntax, scriptlets work just fine if that's your preference. |
|
Live Data Examples
|
The next set of examples uses real-time data to simulate real world applications. The pages
are a little bit more complicated because they actually do some work to acquire data and display
a good looking chart.
As you'll see, however, the chart-building portion of the pages isn't much more complex than the simple examples above. You're probably already doing the data management for your application. Just add KavaChart for instant charting. |
|
Run jsp
See source
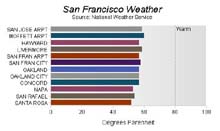
The next example uses an XML data source to display live temperature data from the San Francisco Bay Area. KavaChart gives you a wide range of options to supply data to your charts, including XML Web Services. |
|
|
Run jsp
See source
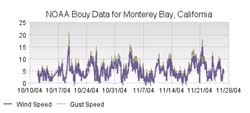
This page includes the complete logic to read data from a buoy in the Pacific Ocean and place it in chart properties to create a fairly complex chart. Often, the quickest way to implement a chart involves reformating existing data resources within your page into chart properties. |
|
|
Run jsp
See source
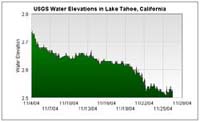
Charts based on USGS water-level data for Lake Tahoe, CA. These charts are generated dynamically from real-time instrument data, and show KavaChart's ability to handle ranges of data gracefully. All the data acquisition logic is contained in the page's source code. This page includes a form that interacts with the data sources to change the number of days data you're viewing. |
|