KavaChart in Action - Examples and Documentation - ProServe
[ Back ] Timeseries Charts - Line & Scatter Charts
|
Line charts are one of the most basic and versatile chart types.
They can be used to display trends over time, to correlate one variable
with another, or to find clusters of information. KavaChart's timeseries line chart
collection includes date line charts that handle discontinuities.
KavaChart ProServe's Timeseries collection includes the following timeseries line chart types:
|
|
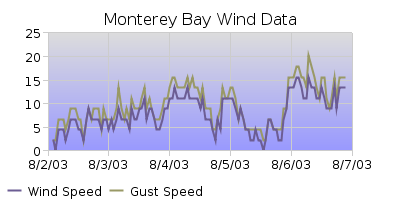
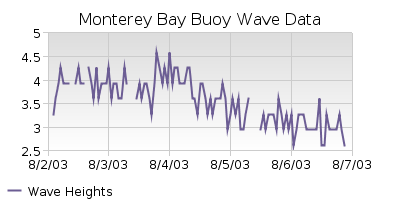
One of the most useful timeseries charts is "dateLineApp". This chart automatically converts time oriented data into comprehensible line charts. This sample shows wind data from a bouy outside Monterey Bay in California. Like all time oriented charts, data can be supplied through the params "dataset0dateValues" and "dataset0yValues", or through external data sources, using "customDatasetHandler" to point to the file or URL that contains your data. If you're pointing to an external file, you can re-read the file periodically by using the param "networkInterval" to define how many seconds you want to use as a data refresh rate. This chart uses "dataset0dateValues", along with "inputDateFormat" to define how the incoming timestamps are formatted. It also uses "dwellLabelDateFormat" to define the dwell labels. The axis date formatting is left to a default value. A time oriented chart scans your data to create a meaningful time or date oriented axis. In our case, the axis interval is one day. Depending on your data, this interval could be one week, a couple of days, a year, a quarter, 5 seconds, or some other meaningful value. The axis extends a bit past the end of our data, and starts a bit before our data to make sure the axis starts and ends on a one day interval, since that's appropriate for these particular charts. If you want an axis that uses a different interval, you can set "scalingType". If you want to use a different axis range, you can use "startDate" and "endDate" parameters. If your data contains discontinuities, just use an unparseable number in place of a Y value ("x", for example), and use "disDateLineApp", which processes the discontinuities as line breaks. |


|
|
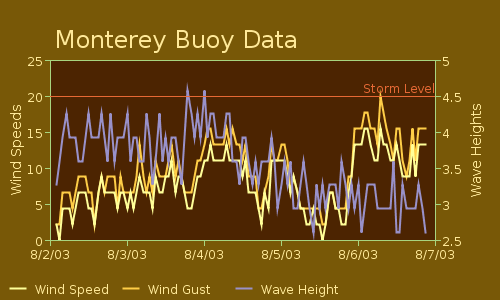
This chart compares wind data with wave heights over a 5 day period. Since winds gust up to about 30 MPH, while swells only range up to about 4.5 meters, the wave data would be completely lost if use use the same scale. By using 2 axes, the wind and wave data can be visually compared together. Data is assigned to the right hand axis with the param "dataset0OnRight". The right hand axis is referred to as the "auxAxis" in style and option parameters, such as "auxAxisStart", "auxAxisGridColor", and so on. Time oriented twin axis charts are suitable for a wide range of applications in energy, environmental science, and finance. This object is "twinAxisDateLineApp". Time and date oriented twin axis charts use the same conventions as other time oriented objects: "inputDateFormat", "axisDateFormat" and "dwellLabelDateFormat" govern the presentation of the time information. Data comes from "customDatasetHandler" or "dataset0dateValues". URL oriented data can be read and re-read using the "networkInterval" parameter. |

|
|
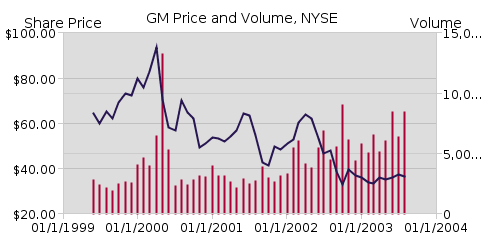
This chart combines various data types. In this case we're comparing prices and volume in the same chart. Prices are in the $30 to $100 range, while volumes range up to about 15,000,000. Clearly, two axes are needed. This chart uses lines and bars. Lines convey trend data while bars communicate discrete point observations. This object, "twinAxisDateComboApp" also uses a time oriented X axis, which is appropriate for many kinds of financial and environmental data. By default, this object uses a special symbol format on the axis to represent very large numbers: 1,000,000 becomes 1M, and so on. This object also lets you represent both line and bar (stick) data on either axis. The param "dataOnRight" assigns data to the right axis. This axis is referred to as the "auxAxis" in other parameters, such as "auxAxisGridColor", and so on. The param "dataset0Type" assigns dataset 0 to be either "Stick" or "Line". |

|
