KavaChart in Action - Examples and Documentation - ProServe
[ Back ] Basic Charts - Area Charts
| Area charts are ideal for showing trends, especially trends that consolidate two or more variables. "areaApp" doesn't really use X values, laying out the observations evenly across the X axis, with one label at each observation. This is convenient for constructing charts that have regular periods. |
Use the source code to this page as a guide in creating your own area charts.
You can also use the KavaChart
ChartWizard
to design your own area charts.
|
|
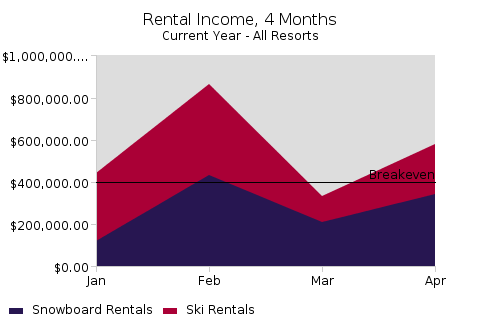
This chart uses a simple chart definiton to describe revenue trends for four months. In production, this chart's data parameters would likely be created by a database connection. In our sample, we just defined some String variables. Change them and your chart will change. Placing your mouse over a region in the chart will show what the actual data values are for that period's ski or snowboard rentals. The format of the numbers is defined using the "dwell" properties. A reference line at "400000" describes a break-even point. Because an area chart stacks values, we can see that our breakeven amount was exceded in every month but March. |

|
|
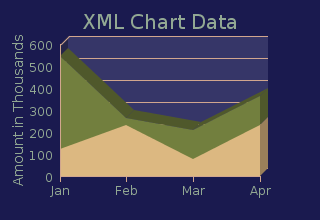
This chart is similar to the previous one, except that it reads XML data from a web service at kavachart.com If you can put your data into XML, it's a simple matter to turn it into a chart. We also spruced this chart up a little by setting a default color palette, "presentation_deep". We also added a Y axis grid, and a Y axis title with the yAxisOptions property. |

|
|
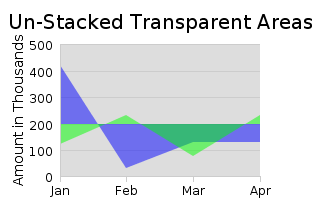
Using the same data, we can "un-stack" the areas and apply a baseline value. Let's say our breakeven number is 200, and we want to see when we're above water and below water for each of our series. Since the data can hide data in the back, we'll make the colors slightly transparent so we can see what's happening in the back area. |

|
|
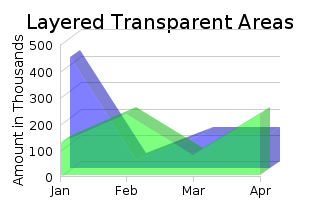
Using transparency, we can also "layer" our areas. This makes a nice looking chart, but it isn't as informative, since the front areas obscure those in the back. |

|
