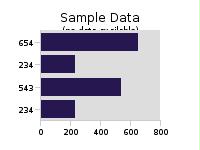
These charts read data from a Web Service that provides temperature data for San Francisco Bay Area cities. ProServe's XMLDataProvider reads XML data in the format defined by this DTD: http://www.kavachart.com/kavachart/KavaChartDataProvider.dtd. The actual data is supplied by this URL: http://www.kavachart.com/weather.jsp, which in turn reads and translates data from a National Weather Service web site.
As temperatures change, the chart's images/KavaChartImages will regenerate a chart as required. If temperatures haven't changed, an existing image is returned by the chart bean.
Like temperatures, your data may not change for every page view. Using KavaChart's image images/KavaChartImages makes the best use of your server computing resources by avoiding unnecessary imaging loads.
