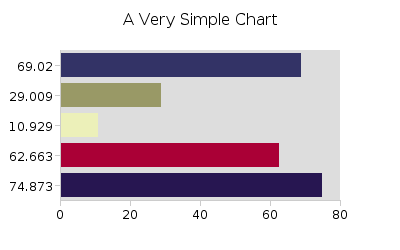
There's not much to this chart. Random data, with mostly default style properties.
How does this work? The chart object contains all the logic for creating a chart image. When we call the method "chart.getFileName()" it creates an image and writes it into the cache directory, set with the "writeDirectory" property. We then point to the equivalent URL with an <IMG> tag.
Our very simple chart:

We can improve this chart by adding an imagemap to it, which supplies tooltip labels. This is done with the "getLinkMap()" method, like this:
