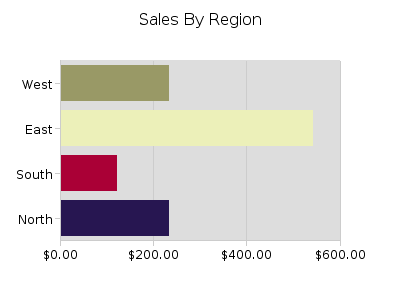
ProServe tags or objects make it easy to implement drill-down features in your charts. The bars in this chart drill down to additional JSPs, which pop up in a JavaScript window. Our additional JSPs use charts (of course), but you can link to anything: tables, external web sites, summary data descriptions, etc.
As you pass the mouse over each bar, you will also see a detail chart that shows sales trends for each region. Although we're using another JSP to generate these charts, a KavaChart based serlvet is probably better practice in a real implementation.